Grafana dashboards can be shared with other community members and stakeholders so they can understand usage and cost patterns. Community Champions can
export data to a CSV file
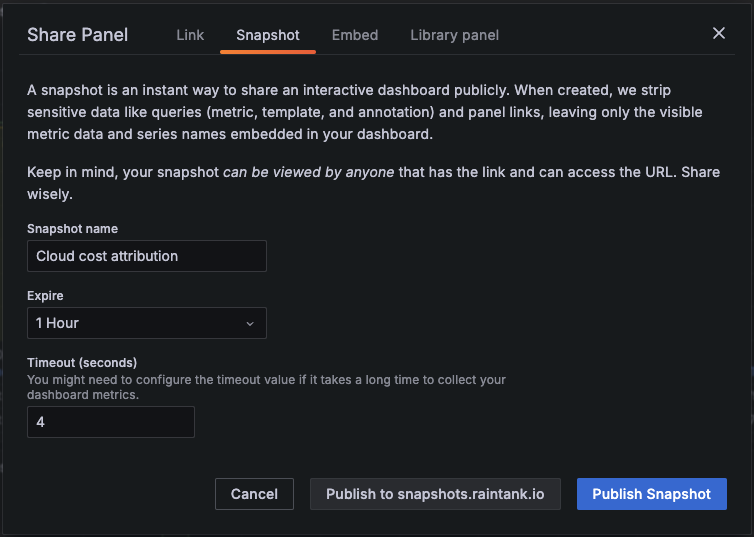
generate a snapshot of the Grafana dashboard and share a public link
or even Programmatically access Prometheus data themselves.
Generate a CSV file
Click on the three dots
 in the top-right corner of the panel you wish to generate a CSV file for.
From the dropdown menu select
 Inspect › Data.
Click on the Download CSV button to download the data as a CSV file.
Share a snapshot of the dashboard or panel
This function is available to Grafana admins only. A snapshot is a frozen view of data that can with others without the need to login with a Grafana account. You can set the snapshot to expire after a certain time period, or even delete them by going to the /dashboard/snapshots page.
If you wish to share the entire dashboard, click on the Share button to the left of the time-range selector.
If you wish to share a single panel, click on the three dots
in the top-right corner of a panel. From the dropdown menu select Share.From the pop-up Share Panel dialog, select the Snapshot tab and fill out the details.
Click the Publish Snapshot button to generate a public link that you can share with others.